
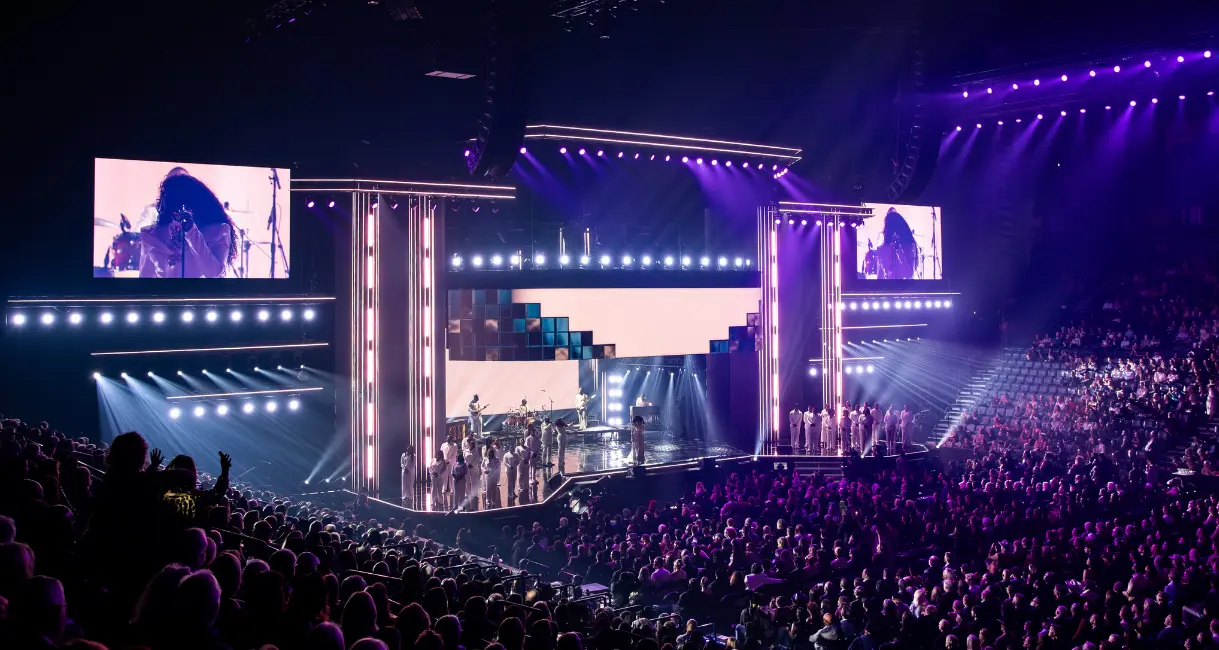

I wanted to take a moment to talk about stage plots. For the uninformed, a stage plot is basically a scale drawing in top view of the stage with an artist’s specific set-up detailed. For the informed, this would simply sound like a horribly boring read…but stay with me.
It has often been said that “proper prior planning prevents poor performance”, and that is certainly the case with stage plots. In the case of a project like the Dove Awards 2026, a stage plot is infinitely more complicated because we do not have time to run sound checks and initial rehearsals in the performance space. Likewise, the lighting and visual team do their pre-programming for three and a half days before we even see the artists. To exacerbate the issue, the set changes in the show range from ten minutes to as little as five (mostly the latter) and there is only time to rehearse these changes once before the show.
For this reason, it is important that the stage plots be extremely detailed and hyper accurate. To accomplish this, all the spike marks (the small tape marks that tell stage technicians where to place risers, microphone stands, props, talent etc.) for the entire set of 12 performances have to be laid out a few weeks in advance. That is definitely an unusual workflow, but it is the only way we’ve figured out to keep everyone on the same page. In the case of this event there were 102 unique spike marks that had to be laid out by coordinates in both the rehearsal hall and on the main stage. Each spike mark in the drawing has a database attached to it so we can track which performances use a specific mark. We try to re-use marks as often as possible to reduce the overall counts and having that data is very helpful, especially when an artist requests a change. We will then know if we can move a mark or add a new one.
Along with the spike mark detail, drum risers depict how many and what size of drums, number of cymbals and any electronics that might be in use. This information is cross-referenced to the audio input list and the artist’s backline request form to ensure that if they asked for four toms, that there are four in the drawing and four on the input list. Likewise, keyboard risers detail which keyboards are to be used and how they are to be configured. Every riser (in this case there were 40 total risers with many of them reconfigured for multiple performances) is saved as a symbol specific to that artist’s performance. More on that shortly.
Each performer has their first name listed by their spike mark or riser and the number of their associated monitor mix. The monitor mix is based on a standardized list so that the engineer always knows that a bass player is on mix 15, drummer is on 16, stage left guitarist is on mix 12, etc. With their name listed, the monitor engineer can avoid saying “hey bass player!” during sound checks leading to a more relaxed and professional atmosphere.
Once the layout for each performance is detailed, we then expand to concern ourselves with the backstage space. Since each riser is specific to a particular performance, we can detail at what point in the event that riser can be pre-set and where it is placed prior to going on stage, hence the use of artist specific symbols. If an artist makes a change to their requirements, this change is not only reflected on the stage plot but also anywhere this riser may appear backstage, ensuring that the technicians are preparing for the next performance accurately. We also detail when to bring artist specific assets up onstage from the floor and where those are placed to be ready for the next set change. Lastly, we detail the movements of risers and props off the stage in the back of the arena so the backstage managers know what to get ready next and when equipment can be struck and loaded onto a waiting truck.
Finally, all of this is drawn in both 2D and 3D using Vectorwork’s hybrid symbol workflow. This allows us to have very legible stage plots for the stage technicians and the ability to export the 3D models of each performance for the lighting and visual teams to program in pre-visualization.
By preparing accurate stage plots, performers know exactly how much space they will have on the actual stage when they are in the rehearsal space. The lighting team can prefocus lighting on any necessary positions in their pre-visualization programming thus saving valuable time on site. With a dedicated crew of 34 backstage technicians—including a lead stage manager, 4 onstage managers, 3 backstage managers, 9 audio technicians, 5 backline technicians, and 12 stagehands—the team gets the details needed to run a fast, successful event with very little rehearsal time.
By the way, we 3D print all of the risers in 1/4”scale and have a 24” x 36” paper print of the stage in case the stage managers want to physically show stage hands how they want to bring assets on and off stage. It’s basically a large format game of “Risk” for stage technicians!
Details, details, details.
Interested in Edgelight and Vectorworks? Visit our website to learn more https://www.edgelightrgb.com/shop

Copyright © Edgelight. All Rights Reserved.